Another data mural is in the works! This time we were pretty crunched for time (one 55 minute class period for the design!) so we decided to limit the scope to an infographic. No time wasted on deciding the format, time was just spent designing the key elements and turning the data story into a mural design.
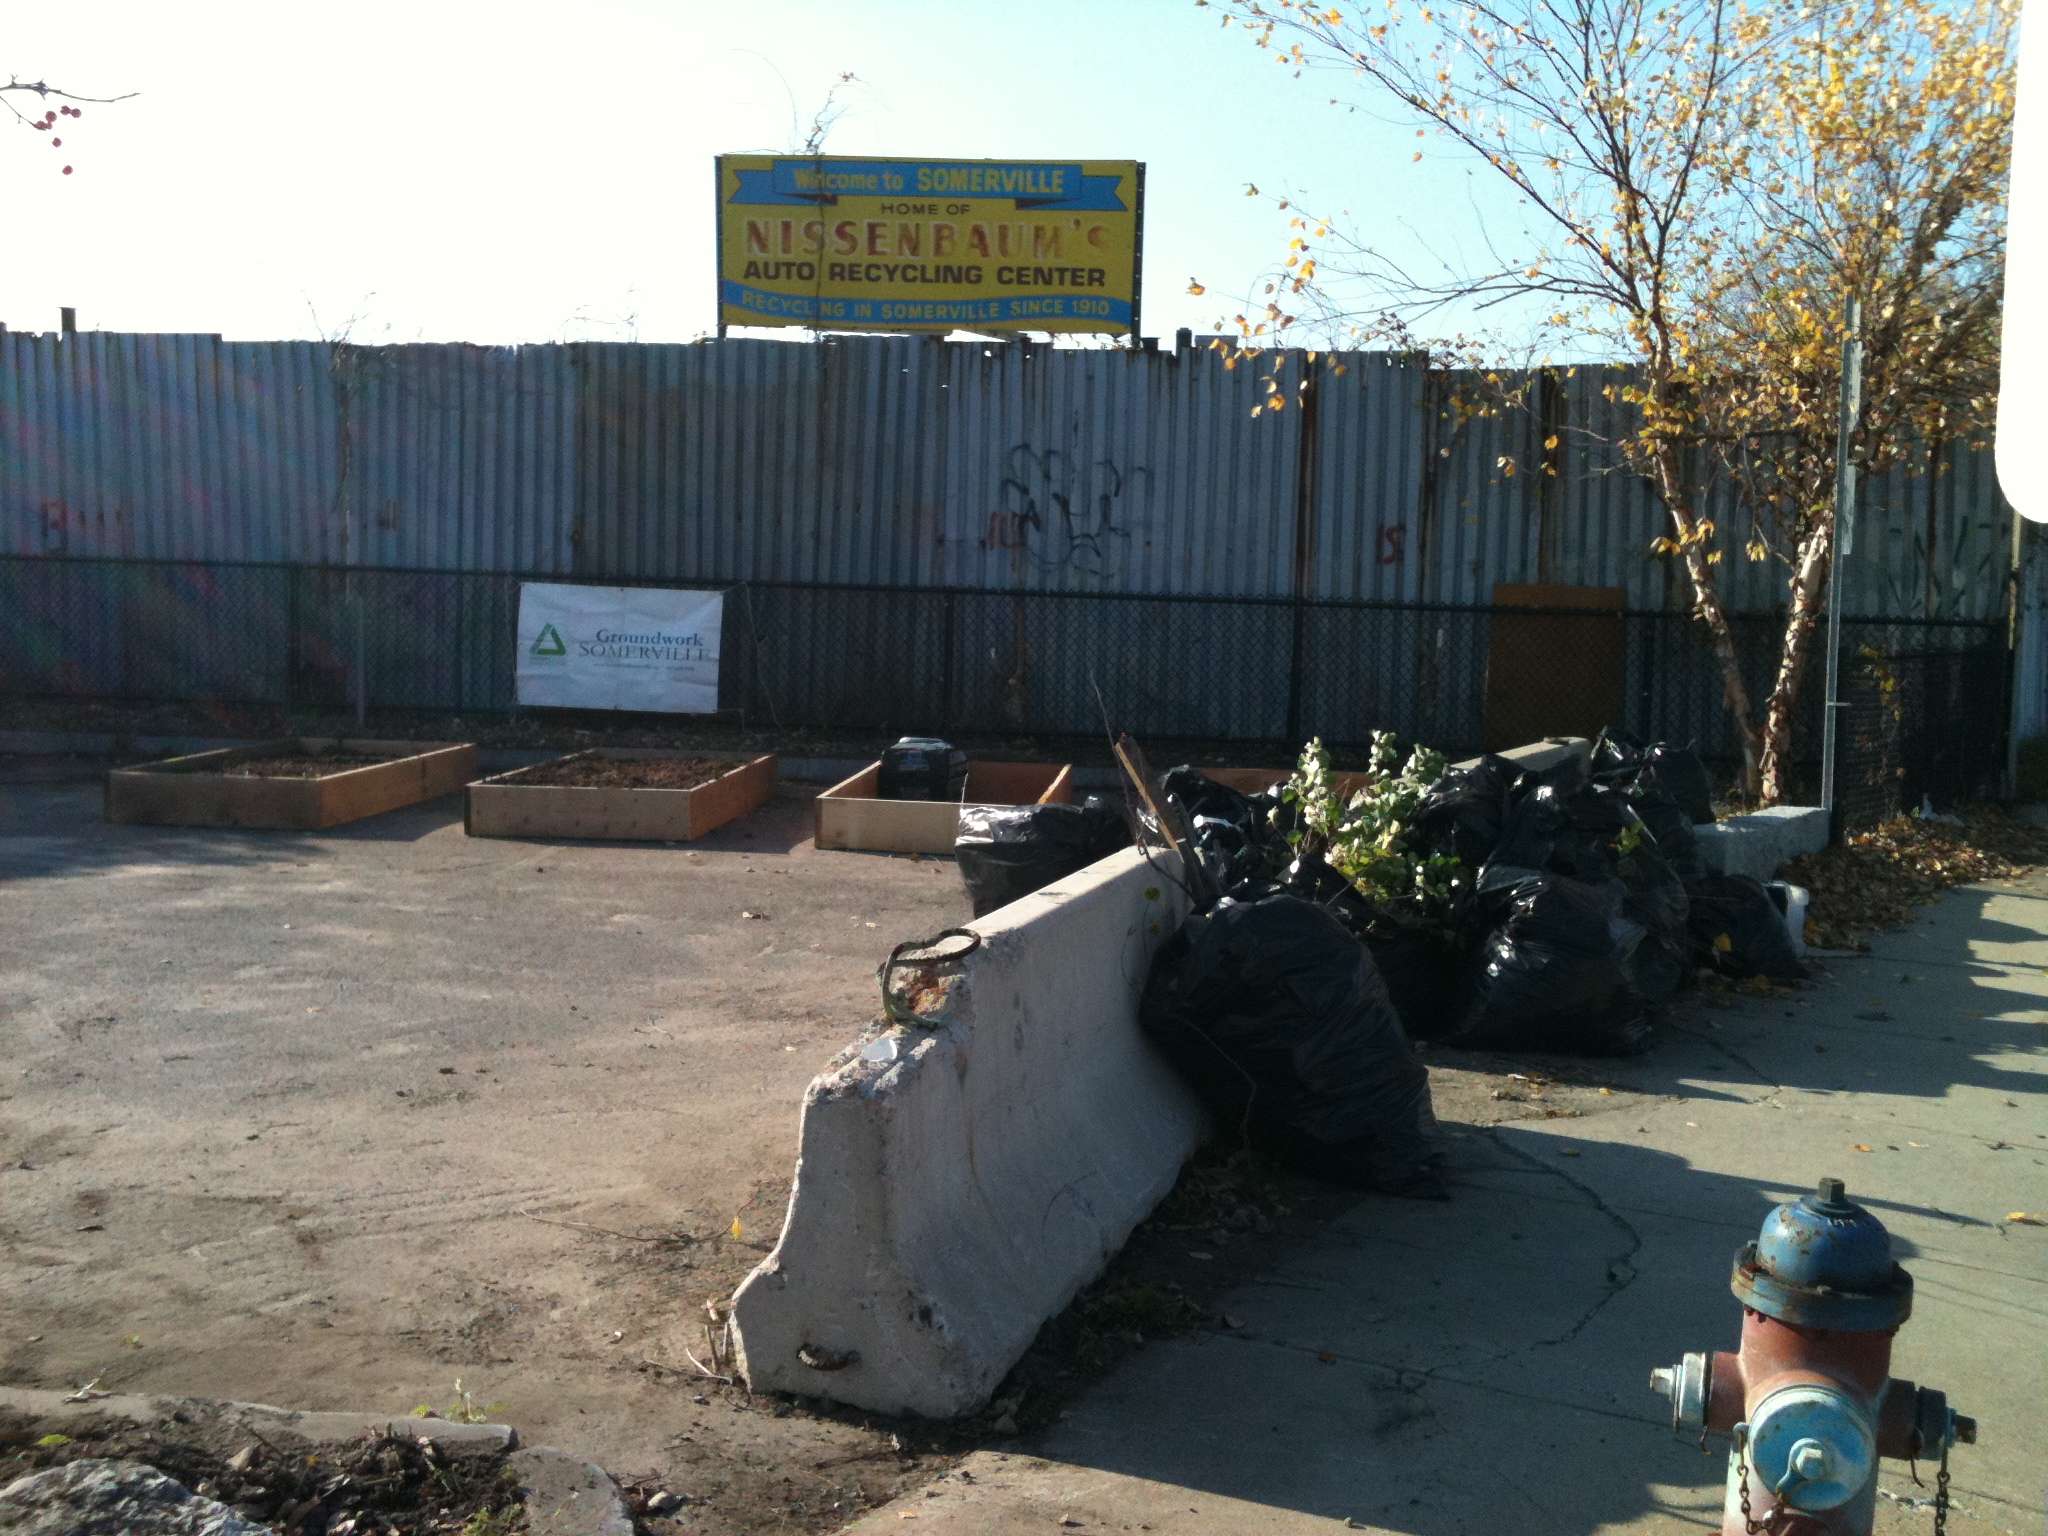
Groundwork Somerville is an amazing organization that’s doing a host of programming and collaboration to make Somerville, MA a greener place. One of their projects is an urban farm that takes up a corner of an auto part lot in a very cement-filled part of the city. The farm has a big empty metal fence as it’s walls (see photo), and they asked us to help design a mural to make the space more lively. A group of students from Prospect Hill Academy will be working on the farm this spring and they will be the ones to design and paint the mural.

Through conversations with Groundwork Somerville we decided that the mural would tell the story of what the organization does and why, using data to illustrate the points. We gathered data about food access, about overall health and about Groundwork Somerville’s accomplishments, and crafted a story. We then brought that story to the Prospect Hill Academy class. After introducing the concept and examples of infographics, we asked each of the students to work in small groups to develop a simple icon or illustration that told one part of the story.
 We’re now in the process of combining the images into one graphic that tells the whole story. We’re excited that on April 27th volunteers will prepare the wall for painting. If all goes well, in a few weeks the students will begin to paint the mural!


